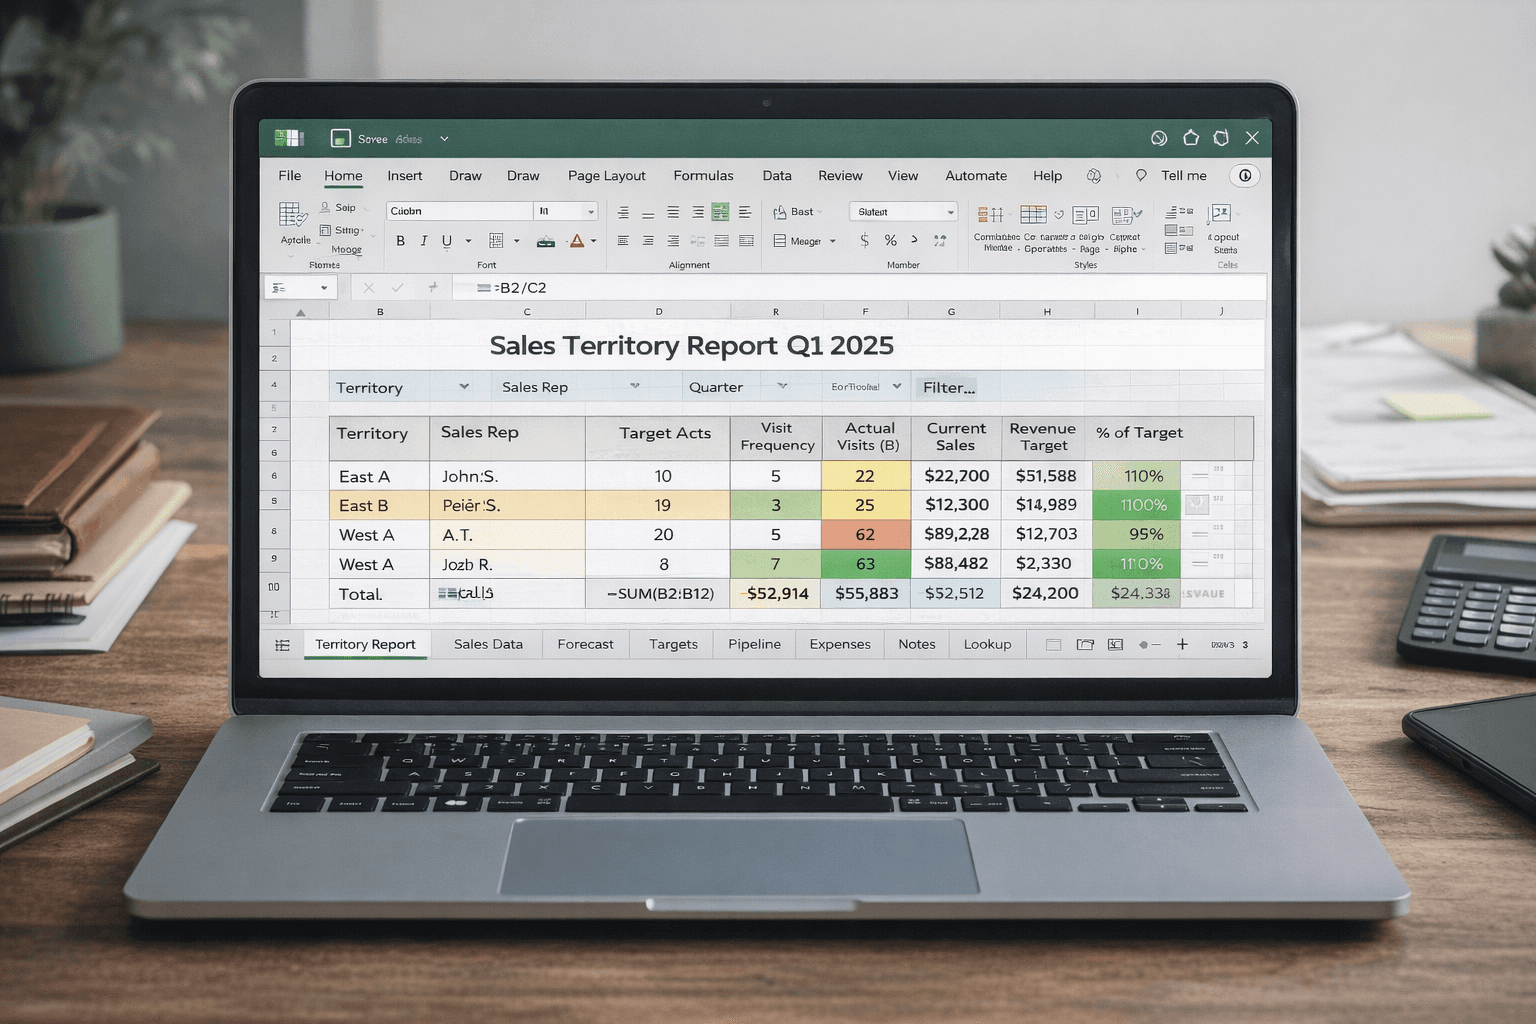
Let's be direct about something: Excel is not a bad tool. It's actually a remarkable tool. It's flexible, accessible, and powerful enough to run complex models in the hands of someone who knows what they're doing.
Territory execution is just not what it was built for.
Territory execution requires real-time visibility into a market that moves every day. It requires the ability to overlay multiple data signals — movement, density, demographics, competitor presence — and translate them into rep-level priorities that actually change behavior at the point of execution. It requires a system that learns from what's working and surfaces new opportunities as the market shifts.
Excel gives you cells. Territory execution requires a different layer entirely.
Here's what happens when organizations try to run territory management in spreadsheets — and what the alternative looks like.
What Territory Management Actually Requires
Before diagnosing the Excel problem, it's worth being precise about what effective territory management needs to do. At its core, it has to answer five questions:
Which zones have the highest conversion potential right now — not six months ago, today?
Which accounts should each rep prioritize this week given current demand signals?
Where is the team underserving relative to available commercial opportunity?
Where should we expand, and in what sequence?
Which territories need redesigning because the market has shifted away from their original assumptions?
These are dynamic questions. They require current data, geographic context, and the ability to model 'what if' scenarios for territory redesign. They're not questions that a static spreadsheet — even an exceptionally well-built one — can reliably answer.
The Five Things Excel Can't Tell You About Your Territory
1. Where demand has moved since you last updated the plan
Commercial markets are not static. Neighborhoods grow. Foot traffic shifts. New commercial corridors develop. A territory plan that was accurate two years ago may be systematically sending reps to zones where opportunity has declined while leaving growing areas undercovered. Excel doesn't track this. It stores whatever you last put into it.
2. Which accounts have the highest conversion probability right now
Account prioritization in Excel is typically based on historical sales performance — who bought from you before, and how much. That's useful data. But it doesn't account for potential: accounts you haven't visited yet, accounts in growing zones, accounts that are underserved by competitors. Historical data tells you what happened. Location signals tell you what's likely to happen.
3. Where your white space is
White space — commercial zones with strong demand but low current coverage — is the highest-value discovery a field sales team can make. Finding it requires overlaying your current coverage against third-party demand signals. Excel has no mechanism for this. You'd need to manually pull external data, map it somehow, and cross-reference it with your rep route data. In practice, nobody does this regularly enough to act on it.
4. How your territory compares to competitor coverage
Knowing where you are is only half the equation. Knowing where your competitors are — and where they're not — is the other half. Zones where competitors are underrepresent your highest-priority expansion targets. This requires external data that simply doesn't live in Excel.
5. Real-time signals that change daily rep priorities
Even if you built a territory management tool in Excel that was excellent at the quarterly planning level, it would fail at the execution level. Reps need daily or weekly guidance on which accounts to prioritize. That requires a system that can ingest current signals, run prioritization logic, and surface actionable lists. That's not a spreadsheet function — it's a software layer.
 |
What Happens When Territory Planning Can't Keep Up
The consequences of running territory management in Excel are rarely dramatic. They're chronic. They accumulate slowly, stay invisible, and show up as a persistent gap between the growth you expect and the growth you get.
Here's what that looks like in practice across the organizations we've worked with:
Rep performance variance is wide and unexplained. Top performers outperform the median by 40–60%, but nobody can articulate exactly why. Some of it is skill. A lot of it is that good reps have learned, over years, where the real demand is — information that a better system would give to everyone.
Territory redesign happens reactively, not proactively. When a region underperforms, the conversation becomes about rep performance before anyone examines whether the territory design is the problem. Redesigns happen after pain, not before opportunity.
Expansion decisions rely on anecdote. When leadership wants to grow into a new region, the conversation is dominated by 'where do we know people' and 'where do our best reps think we should go' rather than data on commercial density, competitor presence, and demand signals.
New rep ramp time is slow. Without a system that surfaces territory knowledge, new reps spend 6–12 months building the mental map that an experienced rep already has. That's 6–12 months of below-potential performance that a data layer could significantly compress.
"The cost of Excel-based territory management isn't the time your ops team spends maintaining spreadsheets. It's the revenue your reps leave on the table because they're working from an outdated map." |
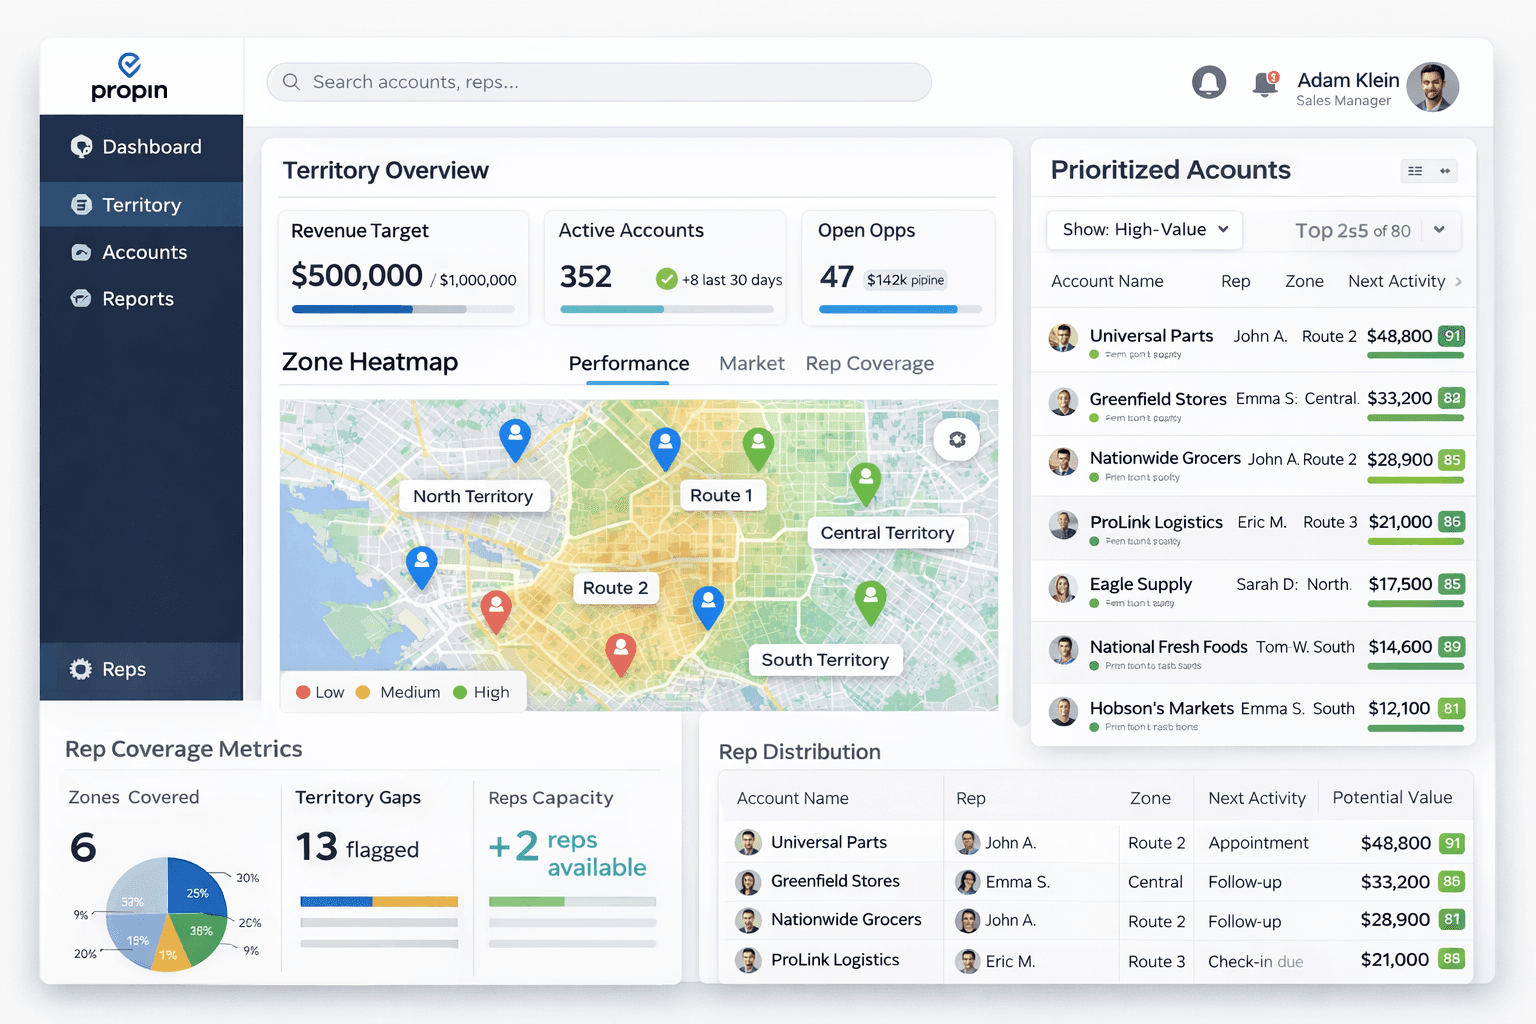
What Modern Territory Execution Actually Looks Like
The shift from spreadsheet-based territory management to location-intelligence-powered execution changes three things about how field sales operates.
Territory design becomes data-driven
Instead of drawing territory lines based on zip codes, historical rep assignments, or executive intuition, territory design starts with demand signals: where is commercial activity concentrated, where is it growing, and how do those distributions map to your current rep coverage? Territory lines get redrawn — and refreshed quarterly — based on the actual shape of demand.
Account prioritization becomes predictive
Instead of reps choosing their own stops based on relationships and habit, each rep starts the week with a prioritized account list built from conversion probability scores. Those scores factor in location signals, historical performance, competitor presence, and visit recency. The rep still owns the relationship — they just start with better information about who's worth seeing now.
Execution becomes measurable at the territory level
When your territory management layer can track coverage against demand, you can answer questions you couldn't answer before: Are we actually covering the high-potential zones? Which territories are saturated and which are underleveraged? Where is the delta between current performance and achievable performance given the demand that's there? These are the questions that drive real strategic decisions.
Is the Migration Difficult?
This is the question we hear most often from ops managers who know the Excel problem is real but are hesitant about the transition cost.
The honest answer is: it depends on what 'migration' means to you. If migration means replacing your CRM or ERP — it doesn't. Propin integrates with your existing systems. It doesn't ask you to change how reps log activity or how ops tracks performance. It sits above those systems, ingesting their outputs and layering location intelligence on top.
If migration means convincing your team to work differently — that requires more attention. Reps who've built their own mental maps of their territory sometimes push back on being told where to go by an algorithm. The solution we've found is to frame it correctly: the system doesn't replace the rep's judgment. It gives them a starting point that's better than the one they currently have. From there, the rep decides.
In our experience, within 30 days of a pilot launch, rep resistance is almost entirely gone — because the early results make the case without anyone needing to make an argument.
